shiny에서 데이터, 스크립트 사용하기
shiny에서 데이터, 스크립트 사용하기
데이터 읽기
사용할 데이터는 counties.rds로 R에서 사용하는 전용 파일 형식(RDS, R Data Format)이다. 다운로드 하여 census-app\data 폴더를 만들어 저장한다.
- counties.rds - here
1
2
counties <- readRDS("census-app/data/counties.rds")
head(counties)
R 스크립트
아래 helpers.R은 지도를 그리기 위한 R 스크립트이다. 다운로드 하여 census-app 폴더에 저장한다.
- helpers.R - here
- install.packages(c(“maps”, “mapproj”)) - 지도를 그리기 위한 필요 패키지 설치
1
2
3
4
5
6
7
8
9
10
11
12
13
14
15
16
17
18
19
20
21
22
23
24
25
26
27
28
29
30
31
32
33
34
35
36
percent_map <- function(var, color, legend.title, min = 0, max = 100) {

  # generate vector of fill colors for map
  shades <- colorRampPalette(c("white", color))(100)

  # constrain gradient to percents that occur between min and max
  var <- pmax(var, min)
  var <- pmin(var, max)
  percents <- as.integer(cut(var, 100,
    include.lowest = TRUE, ordered = TRUE))
  fills <- shades[percents]

  # plot choropleth map
  map("county", fill = TRUE, col = fills,
    resolution = 0, lty = 0, projection = "polyconic",
    myborder = 0, mar = c(0,0,0,0))

  # overlay state borders
  map("state", col = "white", fill = FALSE, add = TRUE,
    lty = 1, lwd = 1, projection = "polyconic",
    myborder = 0, mar = c(0,0,0,0))

  # add a legend
  inc <- (max - min) / 4
  legend.text <- c(paste0(min, " % or less"),
    paste0(min + inc, " %"),
    paste0(min + 2 * inc, " %"),
    paste0(min + 3 * inc, " %"),
    paste0(max, " % or more"))

  legend("bottomleft",
    legend = legend.text,
    fill = shades[c(1, 25, 50, 75, 100)],
    title = legend.title)

}
percent_map()
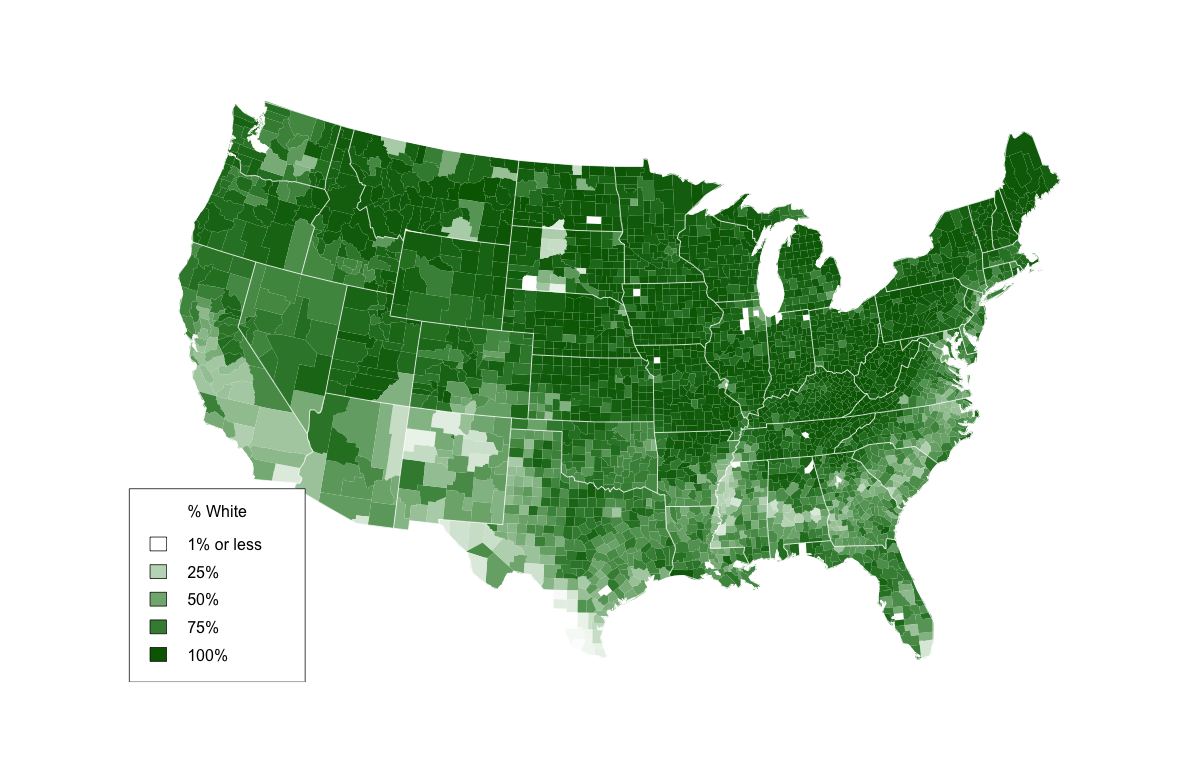
percent_map() 를 실행하면 아래와 같은 결과를 얻을 수 있다.해당 함수는 helpers.R 파일에 작성되어 있고 해당 파일을 source() 함수를 통해 가져올 수 있다.
1
2
3
4
5
library(maps)
library(mapproj)
source("census-app/helpers.R")
counties <- readRDS("census-app/data/counties.rds")
percent_map(counties$white, "darkgreen", "% White")
| Argument | Input |
|---|---|
| var | a column vector from the counties.rds dataset |
| color | any character string you see in the output of colors() |
| legend.title | A character string to use as the title of the plot’s legend |
| max | A parameter for controlling shade range (defaults to 100) |
| min | A parameter for controlling shade range (defaults to 0) |
shiny app 구현
shiny app 구조
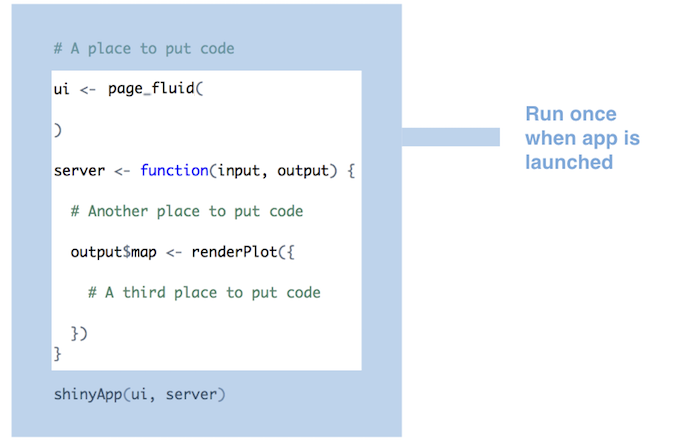
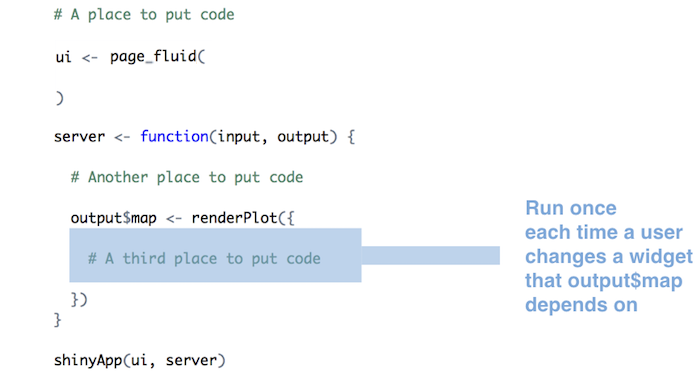
shiny app은 실행될 때 app.R에 포함된 모든 내용이 최초 1회 실행된다. 이후 구현 내용에 따라 변화된 부분만 재실행 되는 구조를 갖는다.
구현 코드
1
2
3
4
5
6
7
8
9
10
11
12
13
14
15
16
17
18
19
20
21
22
23
24
25
26
27
28
29
30
31
32
33
34
35
36
37
38
39
40
41
42
43
44
45
46
47
48
49
50
51
52
53
54
55
56
57
58
59
60
61
62
63
64
65
66
67
68
69
# Load packages ----
library(shiny)
library(bslib)
library(maps)
library(mapproj)

# Load data ----
counties <- readRDS("data/counties.rds")

# Source helper functions -----
source("helpers.R")

# User interface ----
ui <- page_sidebar(
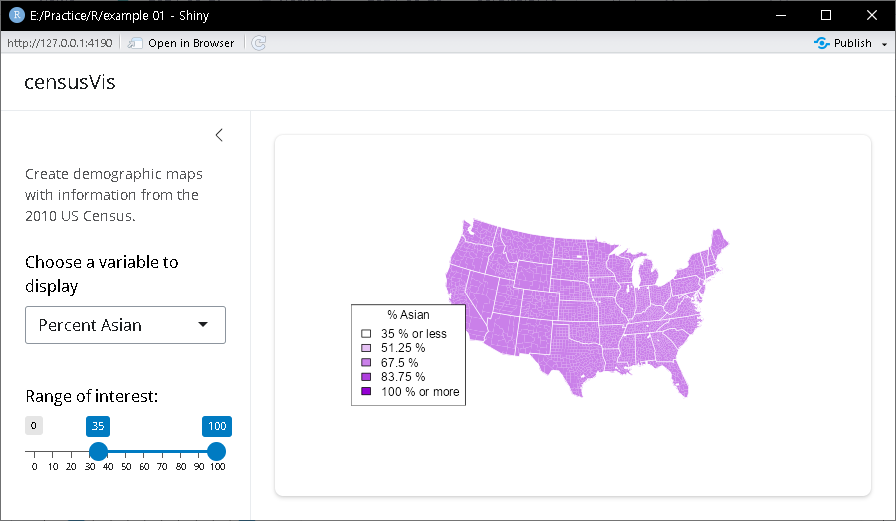
  title = "censusVis",
  sidebar = sidebar(
    helpText(
      "Create demographic maps with information from the 2010 US Census."
    ),
    selectInput(
      "var",
      label = "Choose a variable to display",
      choices =
        c(
          "Percent White",
          "Percent Black",
          "Percent Hispanic",
          "Percent Asian"
        ),
      selected = "Percent White"
    ),
    sliderInput(
      "range",
      label = "Range of interest:",
      min = 0,
      max = 100,
      value = c(0, 100)
    )
  ),
  card(plotOutput("map"))
)

# Server logic ----
server <- function(input, output) {
  output$map <- renderPlot({
    data <- switch(input$var,
                   "Percent White" = counties$white,
                   "Percent Black" = counties$black,
                   "Percent Hispanic" = counties$hispanic,
                   "Percent Asian" = counties$asian)

    color <- switch(input$var,
                    "Percent White" = "darkgreen",
                    "Percent Black" = "black",
                    "Percent Hispanic" = "darkorange",
                    "Percent Asian" = "darkviolet")

    legend <- switch(input$var,
                     "Percent White" = "% White",
                     "Percent Black" = "% Black",
                     "Percent Hispanic" = "% Hispanic",
                     "Percent Asian" = "% Asian")

    percent_map(data, color, legend, input$range[1], input$range[2])
  })
}

# Run app ----
shinyApp(ui, server)
참고자료
- https://shiny.posit.co/r/getstarted/shiny-basics/lesson5/
_EOF_
This post is licensed under CC BY 4.0 by the author.


